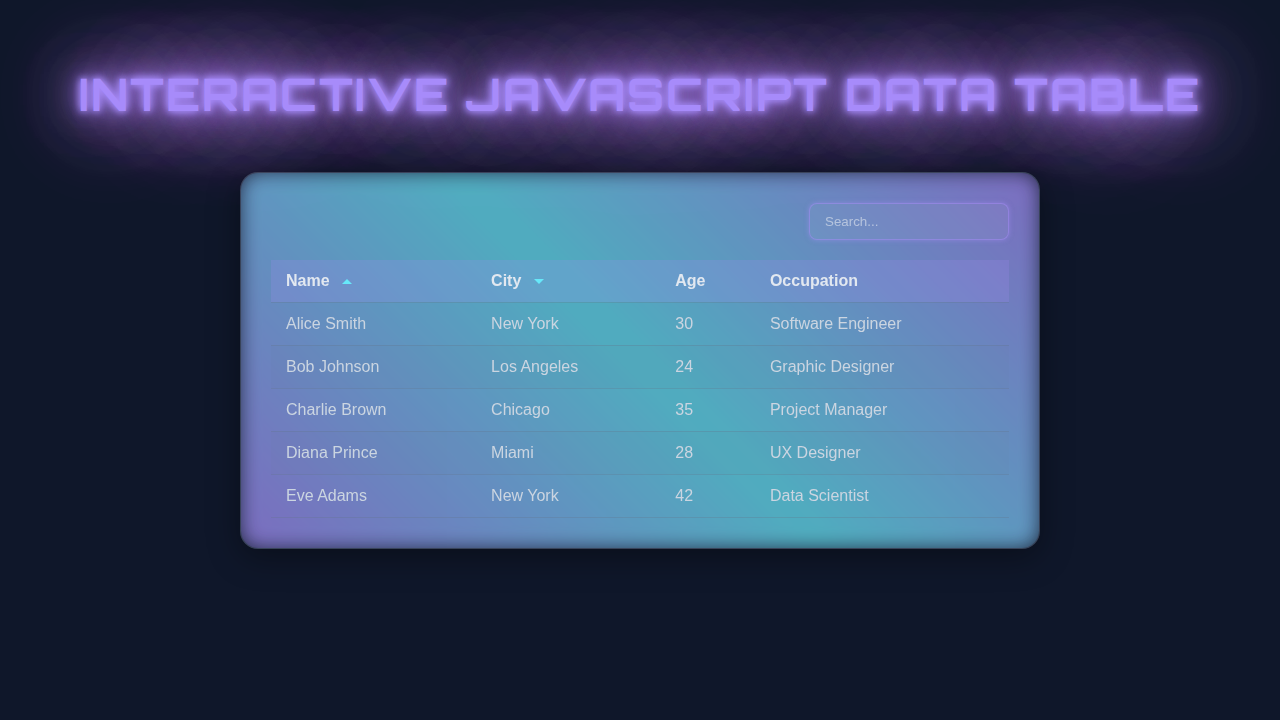
Interactive Data Table with Vanilla JS, HTML, and CSS
Hey there, fellow coder! If you have wanted to build an Interactive Data Table but felt stuck, you are in the perfect place. We are diving deep into creating something genuinely practical and cool today. Imagine a plain table that not only shows data but also comes alive. Users can effortlessly search through hundreds of entries. They can also sort information with a single click. That sounds pretty awesome, right? You will learn how to fetch real data from an API. Plus, we will use only vanilla JavaScript for all the magic. Get ready to build your very own dynamic data table! It’s a skill that will open many doors.
What We Are Building: An Interactive Data Table
Today, we are going to craft a truly dynamic web page component. This component will elegantly display a list of items, such as products, users, or any dataset you can imagine. Our table will break free from being a static, boring display. That’s the truly exciting part! You will empower users to search for specific entries instantly. Moreover, they will be able to sort the data by different columns. This makes navigating and exploring even large datasets incredibly straightforward and fun. Picture using this for a comprehensive product catalog. Or perhaps a flexible list of team members in a company dashboard. It is an indispensable skill. You will definitely want to add it to your growing web development toolkit. We will combine the power of vanilla JavaScript, clean HTML, and responsive CSS to bring this fantastic tool to life.
HTML Structure: Setting the Stage
First, we need the foundational skeleton for our table. This involves a main div container. It will hold all our data table elements. We will also add a simple input field. This is for users to type their search queries. Then comes our essential <table> element. It will feature a <thead> for our column headers. Crucially, it will have an empty <tbody>. This <tbody> is where our data will magically appear. Don’t worry, JavaScript will handle filling it up dynamically!
index.html
<!DOCTYPE html>
<html lang="en">
<head>
    <meta charset="UTF-8">
    <meta name="viewport" content="width=device-width, initial-scale=1.0">
    <title>Interactive JavaScript Data Table</title>
    <link rel="stylesheet" href="styles.css">
</head>
<body>
    <div class="container">
        <h1>Interactive Data Table</h1>

        <div class="controls">
            <input type="text" id="searchInput" placeholder="Search...">
        </div>

        <div class="table-wrapper">
            <table id="dataTable">
                <thead>
                    <tr>
                        <th data-column="name">Name <span class="sort-icon"></span></th>
                        <th data-column="city">City <span class="sort-icon"></span></th>
                        <th data-column="age">Age <span class="sort-icon"></span></th>
                        <th data-column="occupation">Occupation <span class="sort-icon"></span></th>
                    </tr>
                </thead>
                <tbody id="tableBody">
                    <!-- Data rows will be inserted here by JavaScript -->
                </tbody>
            </table>
        </div>
    </div>

    <script src="script.js"></script>
</body>
</html>
CSS Styling: Making It Look Good
Next, we will infuse some CSS to make our table not just functional but also beautiful. We want the information to be super clear. It needs to be easy for anyone to read and understand. We will also style the search box to integrate smoothly. Make sure the table headers are visually distinct. This helps users understand clickable sort options. You can absolutely get creative with your own design tweaks later. These initial styles provide a robust and professional starting point. For more advanced table styling, check out CSS-Tricks on Tables.
styles.css
/* Global Box Model */
* {
    box-sizing: border-box;
}

body {
    font-family: Arial, Helvetica, sans-serif; /* Safe fonts */
    background-color: #f4f7f6;
    color: #333;
    margin: 0;
    padding: 20px;
    line-height: 1.6;
    min-height: 100vh;
    display: flex;
    justify-content: center;
    align-items: flex-start; /* Align to top for better content flow */
}

.container {
    max-width: 900px;
    width: 100%; /* Ensure it takes full width up to max-width */
    margin-top: 50px; /* Add some space from the top */
    background-color: #fff;
    padding: 30px;
    border-radius: 8px;
    box-shadow: 0 2px 10px rgba(0, 0, 0, 0.1);
    overflow: hidden; /* Important for clean edges, especially with borders */
}

h1 {
    text-align: center;
    color: #0056b3;
    margin-bottom: 25px;
}

/* Controls (Search Input) */
.controls {
    margin-bottom: 20px;
    display: flex;
    justify-content: flex-end; /* Align search to the right */
}

#searchInput {
    padding: 10px 15px;
    border: 1px solid #ccc;
    border-radius: 5px;
    width: 100%; /* Make search input responsive */
    max-width: 250px; /* Limit max width */
    font-size: 1em;
    transition: border-color 0.3s, box-shadow 0.3s;
}

#searchInput:focus {
    border-color: #007bff;
    box-shadow: 0 0 0 0.2rem rgba(0, 123, 255, 0.25);
    outline: none;
}

/* Table Styling */
.table-wrapper {
    overflow-x: auto; /* Allows horizontal scrolling on small screens */
    max-width: 100%; /* Ensures wrapper doesn't exceed container */
}

#dataTable {
    width: 100%;
    border-collapse: collapse;
    margin-top: 15px;
}

#dataTable th, #dataTable td {
    padding: 12px 15px;
    text-align: left;
    border-bottom: 1px solid #eee;
}

#dataTable th {
    background-color: #007bff;
    color: white;
    cursor: pointer;
    user-select: none; /* Prevent text selection on header click */
    position: relative; /* For sort icon positioning */
    transition: background-color 0.2s ease;
}

#dataTable th:hover {
    background-color: #0056b3;
}

#dataTable tbody tr:nth-child(even) {
    background-color: #f9f9f9;
}

#dataTable tbody tr:hover {
    background-color: #f0f0f0;
}

/* Sort Icons */
.sort-icon {
    display: inline-block;
    width: 0;
    height: 0;
    margin-left: 8px;
    vertical-align: middle;
    transition: transform 0.2s ease-in-out, border-color 0.2s ease;
}

.sort-icon.asc {
    border-left: 5px solid transparent;
    border-right: 5px solid transparent;
    border-bottom: 5px solid white; /* Up arrow */
}

.sort-icon.desc {
    border-left: 5px solid transparent;
    border-right: 5px solid transparent;
    border-top: 5px solid white; /* Down arrow */
}

/* Hidden by default, shown when active */
#dataTable th:not([data-column].asc):not([data-column].desc) .sort-icon {
    opacity: 0;
}

/* Responsive adjustments */
@media (max-width: 600px) {
    .container {
        padding: 15px;
        margin-top: 20px;
    }

    #searchInput {
        max-width: 100%;
    }

    #dataTable th, #dataTable td {
        padding: 10px;
        font-size: 0.9em;
    }
}
JavaScript: Bringing Life to Our Table
Here’s the really cool part, where all the magic happens! JavaScript will handle all the complex operations. First, we will fetch our data from an external source. Then, we will dynamically create all the table rows and cells right in your browser. We also need dedicated functions for both searching and sorting our data. Event listeners will act as the glue. They will tie every interactive element together. This powerful script makes our data table truly interactive and responsive. You will be amazed at what you can achieve with vanilla JS!
script.js
document.addEventListener('DOMContentLoaded', () => {
    // Sample data for the table
    const data = [
        { name: 'Alice Smith', city: 'New York', age: 30, occupation: 'Software Engineer' },
        { name: 'Bob Johnson', city: 'Los Angeles', age: 24, occupation: 'Graphic Designer' },
        { name: 'Charlie Brown', city: 'Chicago', age: 35, occupation: 'Project Manager' },
        { name: 'Diana Prince', city: 'Miami', age: 28, occupation: 'UX Designer' },
        { name: 'Eve Adams', city: 'New York', age: 42, occupation: 'Data Scientist' },
        { name: 'Frank White', city: 'Houston', age: 50, occupation: 'Marketing Manager' },
        { name: 'Grace Taylor', city: 'Los Angeles', age: 29, occupation: 'Full Stack Developer' },
        { name: 'Henry Green', city: 'Chicago', age: 33, occupation: 'Product Owner' },
        { name: 'Ivy Black', city: 'Miami', age: 22, occupation: 'Junior Developer' },
        { name: 'Jack King', city: 'Houston', age: 45, occupation: 'Sales Director' }
    ];

    const tableBody = document.getElementById('tableBody');
    const searchInput = document.getElementById('searchInput');
    const tableHeaders = document.querySelectorAll('#dataTable th[data-column]');

    let currentData = [...data]; // Data array that will be filtered and sorted
    let sortColumn = null;
    let sortDirection = 'asc'; // 'asc' or 'desc'

    /**
     * Renders the table rows based on the provided data array.
     * Clears existing rows and appends new ones.
     * @param {Array<Object>} rows - The data to display in the table.
     */
    function renderTable(rows) {
        tableBody.innerHTML = ''; // Clear existing rows

        if (rows.length === 0) {
            const noDataRow = document.createElement('tr');
            noDataRow.innerHTML = `<td colspan="${tableHeaders.length}" style="text-align: center; padding: 20px; color: #666;">No data found.</td>`;
            tableBody.appendChild(noDataRow);
            return;
        }

        rows.forEach(item => {
            const row = document.createElement('tr');
            row.innerHTML = `
                <td>${item.name}</td>
                <td>${item.city}</td>
                <td>${item.age}</td>
                <td>${item.occupation}</td>
            `;
            tableBody.appendChild(row);
        });
    }

    /**
     * Filters the base data array based on the search term.
     * The filter applies to all string values in an item.
     * @param {string} searchTerm - The text to search for.
     */
    function filterData(searchTerm) {
        const lowerCaseSearchTerm = searchTerm.toLowerCase();
        currentData = data.filter(item =>
            Object.values(item).some(value =>
                String(value).toLowerCase().includes(lowerCaseSearchTerm)
            )
        );
        applySortAndRender(); // Re-apply sort after filtering and then render
    }

    /**
     * Sorts the currentData array based on the `sortColumn` and `sortDirection` states.
     * Then calls `renderTable` to update the display.
     */
    function applySortAndRender() {
        if (sortColumn) {
            currentData.sort((a, b) => {
                const valA = a[sortColumn];
                const valB = b[sortColumn];

                if (typeof valA === 'string' && typeof valB === 'string') {
                    return sortDirection === 'asc'
                        ? valA.localeCompare(valB)
                        : valB.localeCompare(valA);
                } else {
                    // Handle numeric or other comparable types
                    return sortDirection === 'asc'
                        ? (valA || 0) - (valB || 0) // Treat null/undefined as 0 for numbers
                        : (valB || 0) - (valA || 0);
                }
            });
        }
        renderTable(currentData);
        updateSortIcons(); // Update sort indicators in the headers
    }

    /**
     * Updates the visual sort icons (arrows) on the table headers.
     * Resets all icons and then sets the appropriate class for the active sort column.
     */
    function updateSortIcons() {
        tableHeaders.forEach(header => {
            const icon = header.querySelector('.sort-icon');
            if (icon) {
                // Reset all icons
                icon.className = 'sort-icon';
                if (header.dataset.column === sortColumn) {
                    // Set class for active sort column
                    icon.classList.add(sortDirection);
                }
            }
        });
    }

    // Event listener for search input
    searchInput.addEventListener('keyup', (event) => {
        filterData(event.target.value);
    });

    // Event listeners for table headers (for sorting)
    tableHeaders.forEach(header => {
        header.addEventListener('click', () => {
            const column = header.dataset.column;
            if (sortColumn === column) {
                // If clicking the same column, toggle sort direction
                sortDirection = sortDirection === 'asc' ? 'desc' : 'asc';
            } else {
                // If clicking a new column, set it as the sort column and default to ascending
                sortColumn = column;
                sortDirection = 'asc';
            }
            applySortAndRender(); // Apply sort and re-render the table
        });
    });

    // Initial render of the table when the page loads
    applySortAndRender(); // This also handles the initial sort icon state
});
How It All Works Together: Your Step-by-Step Guide
Let’s really dive into the JavaScript logic now. You’ve prepared your HTML structure. You’ve applied your sleek CSS styles. Now, it’s time to bring everything to life with our script. We will explore each major piece of functionality in detail. Each step builds upon the last.
Fetching Our Data
The absolute first step is to obtain our data source. For this, we harness the power of the Fetch API. It’s a modern, promise-based way to make network requests. Think of it like asking another computer for information. We will typically grab some public data. This could be a list of users, products, or posts. The fetch() function returns a Promise. This Promise is a placeholder for a future result. It eventually resolves into the actual response from the server. Then, we transform that response into a usable JSON data format. This is the raw material we will display in our table. Always remember to handle any potential network errors gracefully. If you want to dig deeper into Promises, the MDN Web Docs on Promises are an excellent resource.
Rendering the Table
Once we successfully have our data, the next step is to display it. We achieve this with a dedicated function, let’s name it renderTable(). This function eagerly accepts the data array as its main argument. First, it clears out any existing rows from the <tbody> element. This ensures we start with a fresh slate. Then, it cleverly iterates through each individual item within our data array. For every single item, it dynamically creates a brand new <tr> (table row). Inside each <tr>, it further creates <td> (table data) cells. We then carefully populate these cells with the corresponding properties from our item. Finally, each newly created row is appended to the <tbody>. This entire process magically updates the table display for the user.
Implementing Search Functionality
A truly Interactive Data Table absolutely needs a robust search bar. This feature allows your users to quickly locate specific entries. We achieve this by attaching an event listener to our search input field. Whenever the user types or changes the input, this listener springs into action. It triggers a dedicated search function. This function intelligently takes the current search term. It then expertly filters our original, full data array. It actively checks if any item’s property includes the user’s search term. We can effectively use JavaScript Array Methods: Master Essential Techniques like filter() for this task. After the data has been filtered, we simply call renderTable() again. This time, we pass in the new, filtered data. The table instantly updates, showing only the relevant results. It’s incredibly satisfying to see!
Adding Sorting Capabilities
Adding sorting elevates the user experience even further. It provides another powerful layer of interaction. Users can simply click on column headers to sort the data. We implement this by adding event listeners to our table headers (<th>). When a header is clicked, our script identifies which specific column it represents. Next, we apply JavaScript’s powerful sort() method. This method efficiently reorders our entire data array. We must provide a custom comparison function. This function tells sort() exactly how to compare different values within the chosen column. It handles sorting alphabetically for strings or numerically for numbers. We also cleverly track the current sort direction. This lets us toggle between ascending and descending order. After the data is perfectly sorted, we invoke renderTable() one final time. This refreshes the table with the beautifully ordered data.
Tips to Customise Your Interactive Data Table
You’ve built an amazing Interactive Data Table! But the fun doesn’t stop here. There are many ways to make it even better.
Pro Tip: Think about pagination for very large datasets. Instead of loading everything at once, fetch data in smaller chunks. This vastly improves performance and user experience!
Here are some ideas for you:
- Add Pagination: If you have hundreds of items, displaying all at once can be overwhelming. Implement controls to show only a few rows per page. This is a common and useful feature.
- Edit/Delete Functionality: Allow users to edit or delete rows directly from the table. This would involve more JavaScript and potentially an API to update your data source. You could even integrate principles from React Lifting State Up: Component Tree & Neon Diagram to manage state changes effectively, even in vanilla JS.
- Filter by Category: Beyond basic search, add dropdown filters. Users could filter by product category or status. This adds more powerful data exploration.
- Save User Preferences: Store the last search term or sort order in
localStorage. This way, the table remembers user settings. - Loading States: Show a “Loading…” message or spinner while data is being fetched. This improves user feedback. You can read about efficient updates in components even if it’s for React, like React Re-Render Explained: Visual Guide & Neon Diagram, to get ideas about managing display changes.
Keep coding! Every new feature you add is a step forward. Don’t be afraid to experiment. That is how you truly learn and grow.
Conclusion: You Did It!
Wow, congratulations, rockstar developer! You have successfully built an absolutely amazing Interactive Data Table. You started with just a basic HTML structure. Then, you skillfully styled it with elegant CSS. Most importantly, you powered it all with robust JavaScript. You learned to fetch data efficiently from an API. You mastered dynamic rendering, intuitive searching, and flexible sorting. This is a truly huge accomplishment! Feel incredibly proud of your work. Share your brand-new project with friends and other developers. Experiment with new features and break things. Your exciting journey as a web developer is just beginning. What amazing interactive component will you build next? Keep exploring. Keep learning. We can’t wait to see what incredible things you create!