Hey! If you’ve ever wanted to build a captivating Dynamic Data Dashboard but felt lost, you’re in the right place. We will create something truly impressive today. Imagine displaying live information automatically. This project shows you how to grab data and make it shine on your page. Get ready to impress yourself!
What We Are Building: Your Own Dynamic Data Dashboard
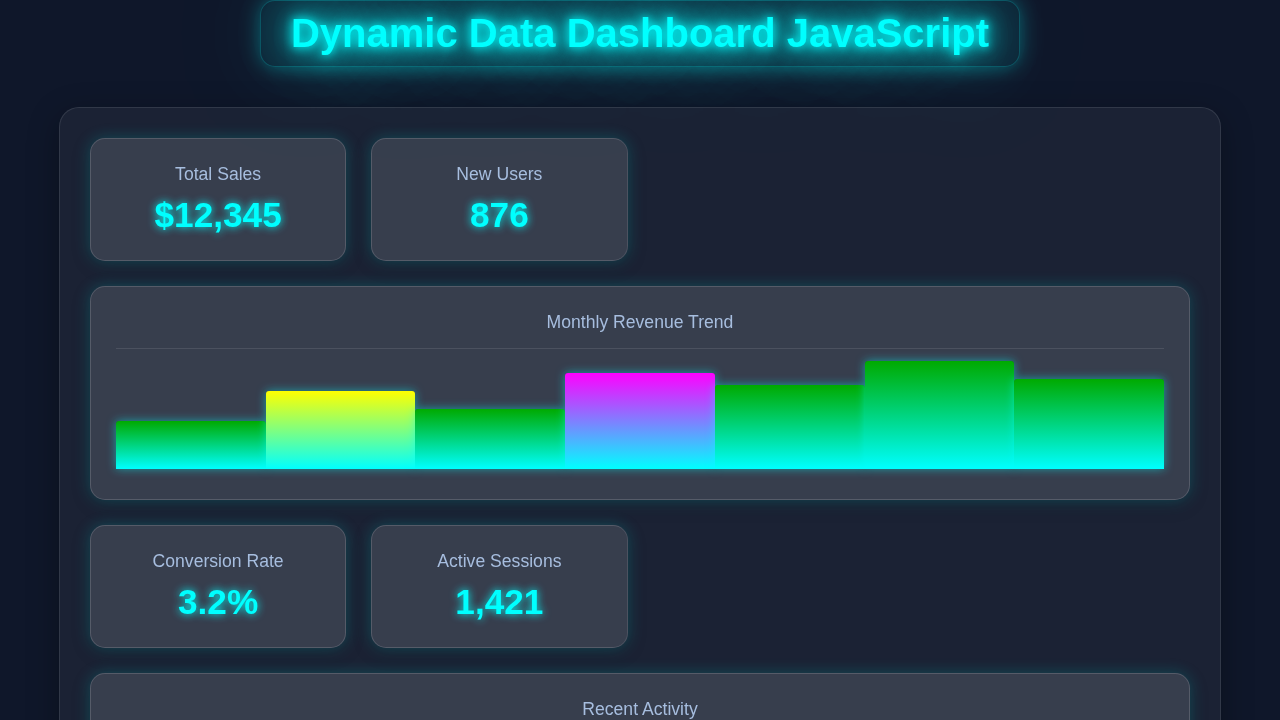
We are going to build a sleek, interactive dashboard. Imagine seeing live updates without refreshing the page! It will fetch data from an external source. Then, it will display this data beautifully on your web page. Think cards showing real-time user counts, product numbers, or sales figures. This project brings your data to life. Furthermore, it makes complex information incredibly easy to understand at a glance. You’ll gain essential web development skills here. Indeed, it’s a fantastic way to practice your JavaScript event listeners and DOM manipulation in a practical setting.
HTML Structure: The Dashboard’s Skeleton
Our HTML forms the robust skeleton of our dashboard. We’ll set up a central container element. This container will neatly hold all our data points. Inside it, we will place several individual ‘data cards.’ Each card will clearly display a title and a dynamic value. This clean, semantic structure makes our dashboard organized. Furthermore, it perfectly prepares us for injecting dynamic content. Don’t worry about the exact numbers or data populating them right away. JavaScript, our trusty helper, will handle all those exciting updates!
index.html
<!DOCTYPE html>
<html lang="en">
<head>
    <meta charset="UTF-8">
    <meta name="viewport" content="width=device-width, initial-scale=1.0">
    <title>Dynamic Data Dashboard</title>
    <link rel="stylesheet" href="styles.css">
</head>
<body>
    <div class="dashboard-header">
        <h1>Dynamic Data Dashboard</h1>
        <button id="refreshDataBtn" class="refresh-button">Refresh Data</button>
    </div>

    <div class="dashboard-grid">
        <!-- Key Metric Card: Total Sales -->
        <div class="dashboard-card" id="card-total-sales">
            <div class="card-title">Total Sales</div>
            <div class="card-value" data-field="totalSales">$0</div>
            <div class="card-indicator increase">+0%</div>
        </div>

        <!-- Key Metric Card: New Users -->
        <div class="dashboard-card" id="card-new-users">
            <div class="card-title">New Users</div>
            <div class="card-value" data-field="newUsers">0</div>
            <div class="card-indicator decrease">-0%</div>
        </div>

        <!-- Chart Card: Monthly Revenue Trend -->
        <div class="dashboard-card full-width" id="card-revenue-trend">
            <div class="card-title">Monthly Revenue Trend</div>
            <div class="chart-container">
                <!-- Bar chart elements will be injected here by JavaScript -->
            </div>
        </div>

        <!-- Key Metric Card: Conversion Rate -->
        <div class="dashboard-card" id="card-conversion-rate">
            <div class="card-title">Conversion Rate</div>
            <div class="card-value" data-field="conversionRate">0%</div>
            <div class="card-indicator increase">+0%</div>
        </div>

        <!-- Key Metric Card: Active Sessions -->
        <div class="dashboard-card" id="card-active-sessions">
            <div class="card-title">Active Sessions</div>
            <div class="card-value" data-field="activeSessions">0</div>
            <div class="card-indicator"><span>No change</span></div>
        </div>

        <!-- List Card: Recent Activity -->
        <div class="dashboard-card full-width" id="card-recent-activity">
            <div class="card-title">Recent Activity</div>
            <ul class="activity-list">
                <!-- Activity items will be injected here by JavaScript -->
            </ul>
        </div>
    </div>

    <script src="script.js"></script>
</body>
</html>
CSS Styling: Making It Look Awesome
Next, we will make our dashboard look absolutely amazing! CSS is where all the visual flair comes to life. We’ll use modern CSS Flexbox to arrange our data cards neatly. They will automatically adapt to different screen sizes. Gradient backgrounds and subtle smooth shadows will make each card truly pop. Our design philosophy here is clean and modern. This thoughtful styling really brings our raw data to life. We will ensure it looks fantastic on any device. Therefore, your beautiful dashboard will always be user-friendly and accessible.
styles.css
/* Global Reset and Box-Sizing */
*, *::before, *::after {
    box-sizing: border-box;
    margin: 0;
    padding: 0;
}

body {
    font-family: Arial, Helvetica, sans-serif; /* Safe font stack */
    background-color: #0f172a; /* Dark background */
    color: #e0e7ff; /* Light bluish text */
    line-height: 1.6;
    display: flex;
    flex-direction: column;
    align-items: center;
    min-height: 100vh;
    padding: 20px;
    overflow-x: hidden; /* Prevent horizontal scroll */
}

/* Dashboard Header */
.dashboard-header {
    width: 100%;
    max-width: 1200px;
    display: flex;
    justify-content: space-between;
    align-items: center;
    margin-bottom: 30px;
    padding: 20px;
    border-radius: 12px;
    background: rgba(255, 255, 255, 0.05); /* Glassmorphism base */
    backdrop-filter: blur(8px);
    border: 1px solid rgba(255, 255, 255, 0.1);
    box-shadow: 0 4px 30px rgba(0, 0, 0, 0.1);
}

.dashboard-header h1 {
    font-size: 2.2em;
    color: #0ff; /* Neon cyan */
    text-shadow: 0 0 10px #0ff;
}

.refresh-button {
    background-color: #00bcd4; /* Cyan */
    color: #0f172a;
    border: none;
    padding: 10px 20px;
    border-radius: 8px;
    cursor: pointer;
    font-size: 1em;
    font-weight: bold;
    transition: background-color 0.3s ease, transform 0.2s ease, box-shadow 0.3s ease;
    box-shadow: 0 0 15px rgba(0, 255, 255, 0.5); /* Neon glow */
}

.refresh-button:hover {
    background-color: #0097a7;
    transform: translateY(-2px);
    box-shadow: 0 0 25px rgba(0, 255, 255, 0.7);
}

/* Dashboard Grid Layout */
.dashboard-grid {
    display: grid;
    grid-template-columns: repeat(auto-fit, minmax(280px, 1fr)); /* Responsive columns */
    gap: 25px;
    width: 100%;
    max-width: 1200px;
}

/* Dashboard Cards */
.dashboard-card {
    background: rgba(255, 255, 255, 0.08); /* Card glassmorphism background */
    backdrop-filter: blur(12px); /* Stronger blur for cards */
    border: 1px solid rgba(255, 255, 255, 0.15);
    border-radius: 15px;
    padding: 25px;
    text-align: center;
    position: relative;
    overflow: hidden;
    box-shadow:
        0 0 15px rgba(0, 255, 255, 0.2), /* Subtle neon glow */
        0 4px 20px rgba(0, 0, 0, 0.2); /* Depth shadow */
    transition: transform 0.2s ease-in-out, box-shadow 0.2s ease-in-out;
    display: flex;
    flex-direction: column;
    justify-content: space-between;
}

.dashboard-card:hover {
    transform: translateY(-5px);
    box-shadow:
        0 0 25px rgba(0, 255, 255, 0.4), /* More intense glow on hover */
        0 6px 25px rgba(0, 0, 0, 0.3);
}

.card-title {
    font-size: 1.1em;
    color: #a7bedf; /* Muted bluish title */
    margin-bottom: 15px;
    font-weight: bold;
}

.card-value {
    font-size: 2.5em;
    font-weight: bold;
    color: #0ff; /* Neon color for values */
    text-shadow: 0 0 8px #0ff; /* Subtle glow for values */
    margin-bottom: 10px;
}

.card-indicator {
    font-size: 0.9em;
    color: #ccc;
    display: flex;
    justify-content: center;
    align-items: center;
    gap: 5px;
}

.card-indicator.increase {
    color: #0f0; /* Green for increase */
    text-shadow: 0 0 5px rgba(0, 255, 0, 0.5);
}

.card-indicator.decrease {
    color: #f00; /* Red for decrease */
    text-shadow: 0 0 5px rgba(255, 0, 0, 0.5);
}

/* Full Width Card for Charts/Lists */
.dashboard-card.full-width {
    grid-column: 1 / -1; /* Spans all available columns */
    min-height: 250px; /* Ensure chart cards have space */
}

/* Chart Container (for bar charts) */
.chart-container {
    display: flex;
    justify-content: space-around;
    align-items: flex-end; /* Bars start from the bottom */
    height: 150px; /* Fixed height for the chart area */
    padding-bottom: 5px; /* Space for bar bottoms */
    border-top: 1px solid rgba(255, 255, 255, 0.1);
    margin-top: auto; /* Push chart to bottom of flex container */
}

.chart-bar {
    width: 15%; /* Width of each bar */
    background: linear-gradient(to top, #0ff, #8a2be2); /* Neon gradient */
    border-radius: 3px 3px 0 0; /* Rounded top corners */
    transition: height 0.5s ease-out, background 0.5s ease-out;
    box-shadow: 0 0 10px rgba(0, 255, 255, 0.5); /* Bar glow */
}
.chart-bar:hover {
    box-shadow: 0 0 15px rgba(0, 255, 255, 0.8), 0 0 15px rgba(138, 43, 226, 0.8);
}


/* Activity List */
.activity-list {
    list-style: none;
    padding: 0;
    margin-top: 10px;
    text-align: left;
    height: 100%; /* Occupy available height */
    overflow-y: auto; /* Allow scrolling for many activities */
    -ms-overflow-style: none; /* IE and Edge */
    scrollbar-width: none; /* Firefox */
}
.activity-list::-webkit-scrollbar {
    display: none; /* Chrome, Safari, Opera */
}


.activity-item {
    padding: 10px 0;
    border-bottom: 1px dashed rgba(255, 255, 255, 0.08);
    display: flex;
    justify-content: space-between;
    align-items: center;
    font-size: 0.9em;
    color: #c0d9ef;
}
.activity-item:last-child {
    border-bottom: none;
}
.activity-item .timestamp {
    color: #8c9eff;
    font-size: 0.8em;
    min-width: 80px; /* Ensure timestamp doesn't wrap too much */
    text-align: right;
}

/* Responsive adjustments */
@media (max-width: 768px) {
    .dashboard-header {
        flex-direction: column;
        text-align: center;
        gap: 15px;
    }
    .dashboard-header h1 {
        font-size: 1.8em;
    }
    .refresh-button {
        width: 100%;
    }
    .dashboard-grid {
        grid-template-columns: 1fr; /* Stack cards on smaller screens */
    }
}
JavaScript: The Brains Behind the Dynamic Data Dashboard
Now, for the brain of our entire operation: JavaScript! This is where the real magic happens. We’ll harness the powerful Fetch API. This amazing tool helps us securely get data from literally anywhere on the internet. Then, with that fresh data in hand, we will skillfully update our HTML. This is truly where the ‘dynamic’ part of our dashboard shines brightest. We’ll make our dashboard update itself automatically. You will truly master asynchronous operations today. Indeed, understanding fetch is a crucial skill for any modern web developer.
script.js
document.addEventListener('DOMContentLoaded', () => {
    const refreshButton = document.getElementById('refreshDataBtn');

    // Function to simulate fetching data
    async function fetchDashboardData() {
        // Simulate network delay
        await new Promise(resolve => setTimeout(resolve, 800));

        // Generate dynamic mock data
        const sales = Math.floor(Math.random() * 10000) + 5000;
        const newUsers = Math.floor(Math.random() * 500) + 100;
        const conversionRate = (Math.random() * 2 + 2).toFixed(1); // 2.0% - 4.0%
        const activeSessions = Math.floor(Math.random() * 2000) + 500;

        // Generate trend data for the bar chart (e.g., last 7 days/months)
        const revenueTrend = Array.from({ length: 7 }, () =>
            Math.floor(Math.random() * 1500) + 500 // 500-2000 units
        );

        // Generate recent activity
        const activities = [
            `User 'Alice T.' logged in`,
            `New order #${Math.floor(Math.random() * 100000)} received`,
            `Product 'Cool Widget' viewed 150 times`,
            `Support ticket #EN${Math.floor(Math.random() * 999)} opened`,
            `Analytics report generated`,
            `Server load at ${Math.floor(Math.random() * 30) + 10}%`,
        ];
        const recentActivity = Array.from({ length: Math.floor(Math.random() * 3) + 3 }, () => {
            const index = Math.floor(Math.random() * activities.length);
            const timeAgo = Math.floor(Math.random() * 60) + 1; // 1-60 minutes
            return {
                message: activities[index],
                timestamp: `${timeAgo} min ago`
            };
        });

        return {
            totalSales: sales,
            newUsers: newUsers,
            conversionRate: parseFloat(conversionRate),
            activeSessions: activeSessions,
            revenueTrend: revenueTrend,
            recentActivity: recentActivity
        };
    }

    // Function to update a key metric card
    function updateMetricCard(cardId, dataField, value, prefix = '', suffix = '', percentageChange = null) {
        const card = document.getElementById(cardId);
        if (!card) return;

        const valueElement = card.querySelector('.card-value[data-field]');
        const indicatorElement = card.querySelector('.card-indicator');

        if (valueElement) {
            valueElement.textContent = `${prefix}${value.toLocaleString()}${suffix}`;
        }

        if (indicatorElement && percentageChange !== null) {
            indicatorElement.className = 'card-indicator'; // Reset classes
            if (percentageChange > 0) {
                indicatorElement.classList.add('increase');
                indicatorElement.textContent = `+${percentageChange.toFixed(1)}%`;
            } else if (percentageChange < 0) {
                indicatorElement.classList.add('decrease');
                indicatorElement.textContent = `${percentageChange.toFixed(1)}%`;
            } else {
                indicatorElement.textContent = `No change`;
            }
        } else if (indicatorElement) {
            // Default text if no percentage change provided
            indicatorElement.textContent = `Updated: ${new Date().toLocaleTimeString()}`;
        }
    }

    // Function to render the bar chart
    function renderBarChart(data) {
        const chartContainer = document.querySelector('#card-revenue-trend .chart-container');
        if (!chartContainer) return;

        chartContainer.innerHTML = ''; // Clear previous bars

        const maxVal = Math.max(...data);
        data.forEach(val => {
            const bar = document.createElement('div');
            bar.className = 'chart-bar';
            // Calculate height as a percentage of maxVal, ensuring a min height for visibility
            const heightPercentage = (val / maxVal) * 100;
            bar.style.height = `${Math.max(10, heightPercentage)}%`; // Min height 10%
            chartContainer.appendChild(bar);
        });
    }

    // Function to render recent activity
    function renderRecentActivity(activityList) {
        const activityUl = document.querySelector('#card-recent-activity .activity-list');
        if (!activityUl) return;

        activityUl.innerHTML = ''; // Clear previous activities

        activityList.forEach(activity => {
            const li = document.createElement('li');
            li.className = 'activity-item';
            li.innerHTML = `<span>${activity.message}</span> <span class="timestamp">${activity.timestamp}</span>`;
            activityUl.appendChild(li);
        });
    }

    // Main function to update the entire dashboard
    let previousData = {}; // Store previous data for comparison

    async function updateDashboard() {
        console.log('Fetching and updating dashboard data...');
        try {
            const currentData = await fetchDashboardData();

            // Calculate percentage changes
            const totalSalesChange = previousData.totalSales ? ((currentData.totalSales - previousData.totalSales) / previousData.totalSales) * 100 : 0;
            const newUsersChange = previousData.newUsers ? ((currentData.newUsers - previousData.newUsers) / previousData.newUsers) * 100 : 0;
            const conversionRateChange = previousData.conversionRate ? ((currentData.conversionRate - previousData.conversionRate) / previousData.conversionRate) * 100 : 0;

            // Update key metric cards
            updateMetricCard('card-total-sales', 'totalSales', currentData.totalSales, '$', '', totalSalesChange);
            updateMetricCard('card-new-users', 'newUsers', currentData.newUsers, '', '', newUsersChange);
            updateMetricCard('card-conversion-rate', 'conversionRate', currentData.conversionRate, '', '%', conversionRateChange);
            updateMetricCard('card-active-sessions', 'activeSessions', currentData.activeSessions); // No percentage change for sessions for this example

            // Render chart
            renderBarChart(currentData.revenueTrend);

            // Render recent activity
            renderRecentActivity(currentData.recentActivity);

            // Store current data for next comparison
            previousData = currentData;

        } catch (error) {
            console.error('Error updating dashboard:', error);
            // Optionally display an error message on the dashboard
        }
    }

    // Initial dashboard load
    updateDashboard();

    // Refresh data every 10 seconds
    setInterval(updateDashboard, 10000); // 10 seconds

    // Manual refresh button handler
    refreshButton.addEventListener('click', updateDashboard);
});
How Your Dynamic Data Dashboard Works: A Step-by-Step Guide
Let’s dive deeper and break down exactly how all these pieces fit together. Building a compelling Dynamic Data Dashboard involves careful orchestration. First, we need to fetch data efficiently. Then, we process that data effectively. Finally, we display it beautifully on your screen. Each of these steps is vitally important. We will walk you through the entire flow comprehensively. Therefore, you will understand every single part of this exciting process.
Setting Up Our Data Source (The Mock API)
First and foremost, we absolutely need some data to display. For the purpose of this tutorial, we will pretend to fetch data from a simple, mock API. Imagine a distant server sending us vital information. This could be anything! Perhaps it provides real-time user counts, product inventory numbers, or daily sales figures. In a real-world application, this might be a complex public API. Alternatively, it could be your very own custom backend server. The JavaScript Fetch API is our tool for interacting with these diverse sources easily. We are simply simulating that interaction here today. This smart approach lets us fully focus on the critical front-end logic. You can easily experiment with different data endpoints later. For now, let’s confidently assume our data arrives in a familiar JSON format.
Pro Tip: JSON (JavaScript Object Notation) is a lightweight data-interchange format. It’s easy for humans to read and write. It’s also easy for machines to parse and generate. Most web APIs return data in JSON. Get familiar with its structure!
Fetching Data with JavaScript’s Fetch API
Here’s the truly cool part: actually getting that data! Our JavaScript leverages the powerful fetch() function. This essential function initiates an HTTP request to our designated data source. Importantly, it returns a Promise. A Promise is a special JavaScript object. It represents the eventual completion (or indeed, failure) of an asynchronous operation. You can explore more about the Fetch API on MDN. We wisely use the async and await keywords to handle these Promises. This elegant syntax makes asynchronous code read almost like synchronous code. Therefore, it’s much, much easier to understand and debug. The await keyword smartly pauses function execution. It patiently waits until the Promise fully settles (either resolves successfully or rejects with an error). Finally, we parse the network response into usable JSON. This gives us a neat JavaScript object we can immediately start working with.
Updating the Dashboard (DOM Manipulation)
Once we have successfully fetched and processed our data, we absolutely need to show it off! This is precisely where DOM manipulation becomes vital. The Document Object Model (DOM) is like a tree-like representation of your entire HTML structure. Crucially, JavaScript can interact with this tree. We meticulously select specific HTML elements using document.querySelector(). For instance, we specifically target the <span> tags that are designated for holding our dynamic data values. Then, we simply update their textContent property. We assign the fresh data value we just received. This immediately changes what the user sees on their screen. It makes our entire dashboard wonderfully responsive and interactive. The data magically appears or updates in real-time! Indeed, this is a core concept behind all interactive web pages. If you’re keen on managing these kinds of dynamic changes in more complex UIs, checking out Mastering React useEffect Hook offers fantastic insights into how modern frameworks handle side effects and data updates with elegance.
Automating Updates (Making it Truly Dynamic)
A static dashboard, while useful, isn’t truly dynamic, is it? We definitely want our data to refresh automatically. This is precisely where the setInterval() function proves incredibly useful. We simply wrap our entire data fetching and DOM update logic inside a single, reusable function. Then, we make a call to setInterval(), passing in our function as the first argument. As the second argument, we specify an interval. For example, 5000 milliseconds means every 5 seconds. The browser will then repeatedly execute our function at that precise interval. Your dashboard will magically update itself, keeping the information wonderfully fresh. This makes our project genuinely and powerfully dynamic. Just a quick reminder: always remember to clear this interval if your dashboard component is ever removed from the page! This smart practice helps prevent potential memory leaks.
Tips to Customise Your Dynamic Data Dashboard
You’ve built an amazing foundation! Now, let’s explore ways to make it even better.
- Integrate Different APIs: Try fetching real-time weather data. Perhaps use a stock market API. There are countless public APIs available. Each new API will challenge your data handling skills. It will expand your dashboard’s capabilities.
- Add Visualizations: Display your data in charts and graphs. Libraries like Chart.js or D3.js can help. Visualize trends or comparisons beautifully. A picture often tells a thousand words. Explore Flexbox on CSS-Tricks to manage complex chart layouts.
- Implement User Controls: Add buttons or dropdowns. Let users select different data views. They could filter by region or time period. This adds interactivity. It makes your dashboard more engaging.
- Real-time Updates with WebSockets: For truly instantaneous updates, explore WebSockets. Instead of polling with
setInterval, a WebSocket connection stays open. The server pushes updates directly to your dashboard. This is perfect for live chats or very fast-moving data. It’s a step up from Fetch API. You might even find parallels with concepts in React Streaming Chat UI.
Keep Learning: Web development is a journey, not a destination. Every project, even a simple dashboard, teaches you something new. Don’t be afraid to break things and experiment!
Conclusion: You Did It!
Congratulations, truly! You have successfully built a powerful and interactive Dynamic Data Dashboard. This is a huge accomplishment! You’ve expertly mastered fetching data with the Fetch API in JavaScript. You’ve learned to update the DOM seamlessly and efficiently. Your skills across HTML, CSS, and JS are undeniably growing stronger with each line of code. This project represents a huge step forward in your web development journey. You now possess a solid understanding of how modern web applications display changing data in real-time. Feel incredibly proud of your accomplishment! Please share your awesome dashboard with us. We’d absolutely love to see what creative things you’ve built. Keep coding, keep building, and always keep learning!